Did you know that you can navigate the posts by swiping left and right?
How did Federer beat Nadal? | Australian Open '17
07 May 2017
. category:
math
.
Comments
#tennis
#federer
#nadal
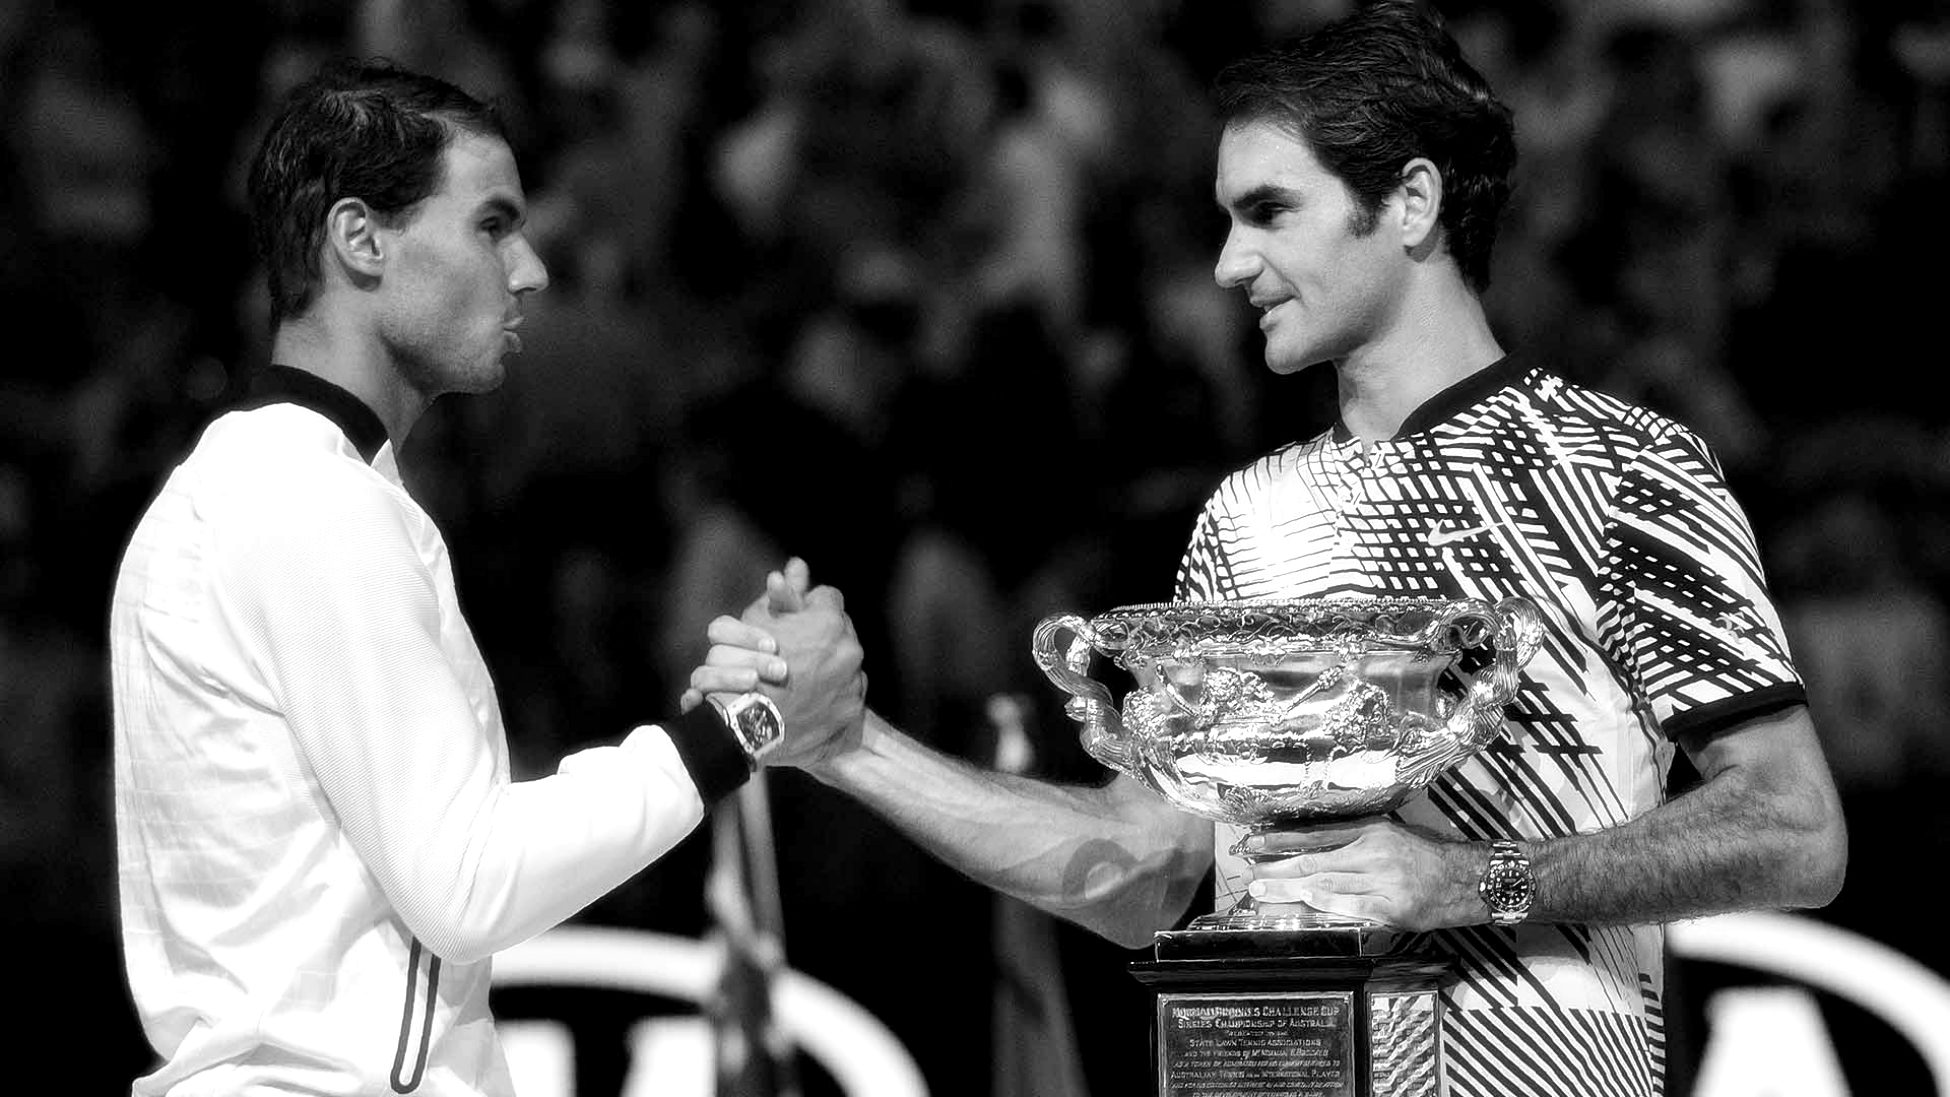
A recap for those living under a rock – The Australian Open Finals between Federer and Nadal was played in Melbourne on the 29th of January earlier this year. Federer came out trumps in an epic five-setter 6-4 3-6 6-1 3-6 6-3, a perfect see-saw scripted for the movies! Both players had shown incredible perseverance throughout the tournament, especially since both were making comebacks post long injury layoffs. For Roger and Rafa, it marked the beginning of a season of extraordinary gameplay, and for me, lots of data to analyze!
I’ve been wanting to do a real deep dive into the Fedal rivalry, and the Aus Open Finale seemed like a nice starting point. Thanks to the incredible Charting Project, the world has access to shot-by-shot analysis of most of the recent matches. Absolute gold for tennis geeks like us ;)
In this blog, we’ll be peeking behind Rafa’s beastly forehands, Roger’s beautiful backhand returns and everything in between. How well did they serve on the Ad court, were body serves effective against Roger, and from where did Rafa finish the long rallies? Roger’s backhands were discussed a lot, did he hit them deep, or down the line? Who dominated the rallies, who handled pressure better, and a lot MORE!

Shot Making
Lets look at their shot-making – Expectedly forehand groundstrokes and backhand groundstrokes lead the pack, followed by backhand slices and others.
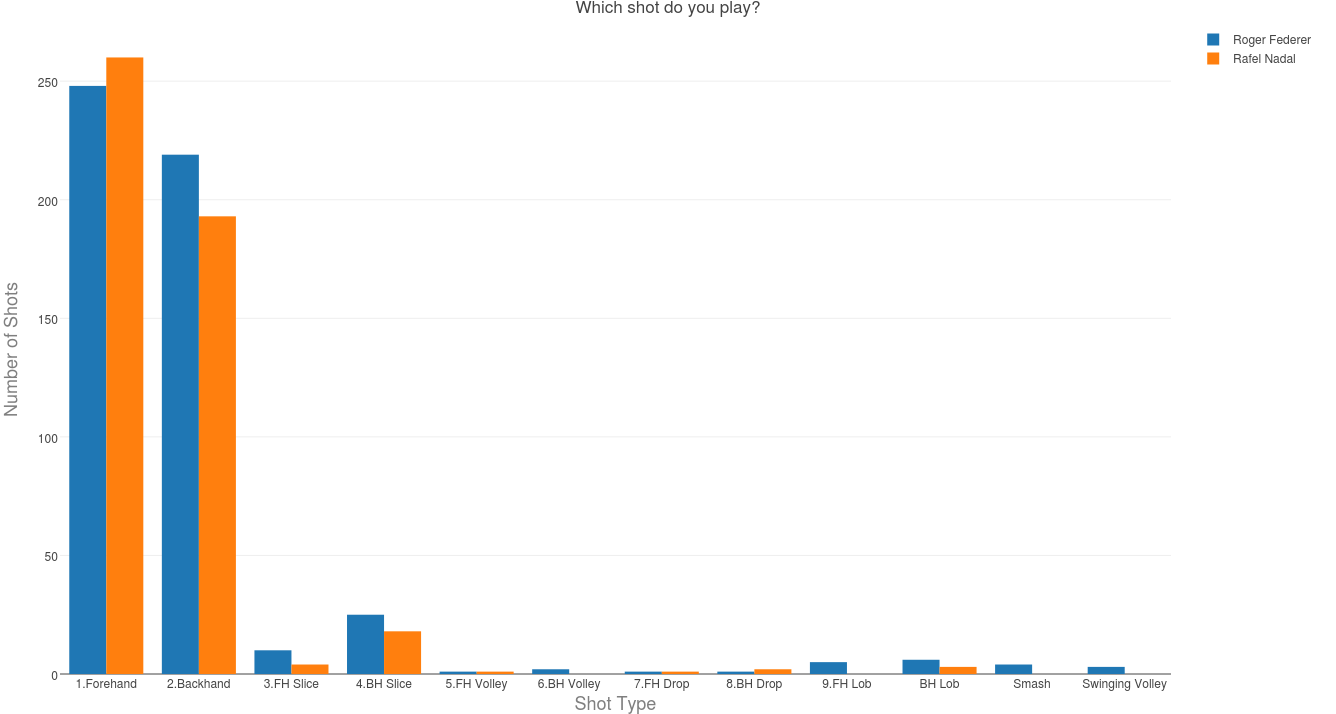
Interestingly, Rafa hits more forehands than Roger, while Roger hits more backhands than Rafa – Most likely a result of Nadal covering up his backhands setting up for the inside-ins and inside-outs! More on them soon :)
Win percentages by rally length
Its a well-known Nadal strategy to extend rallies, and force errors from the opponent. Did that work against Roger?
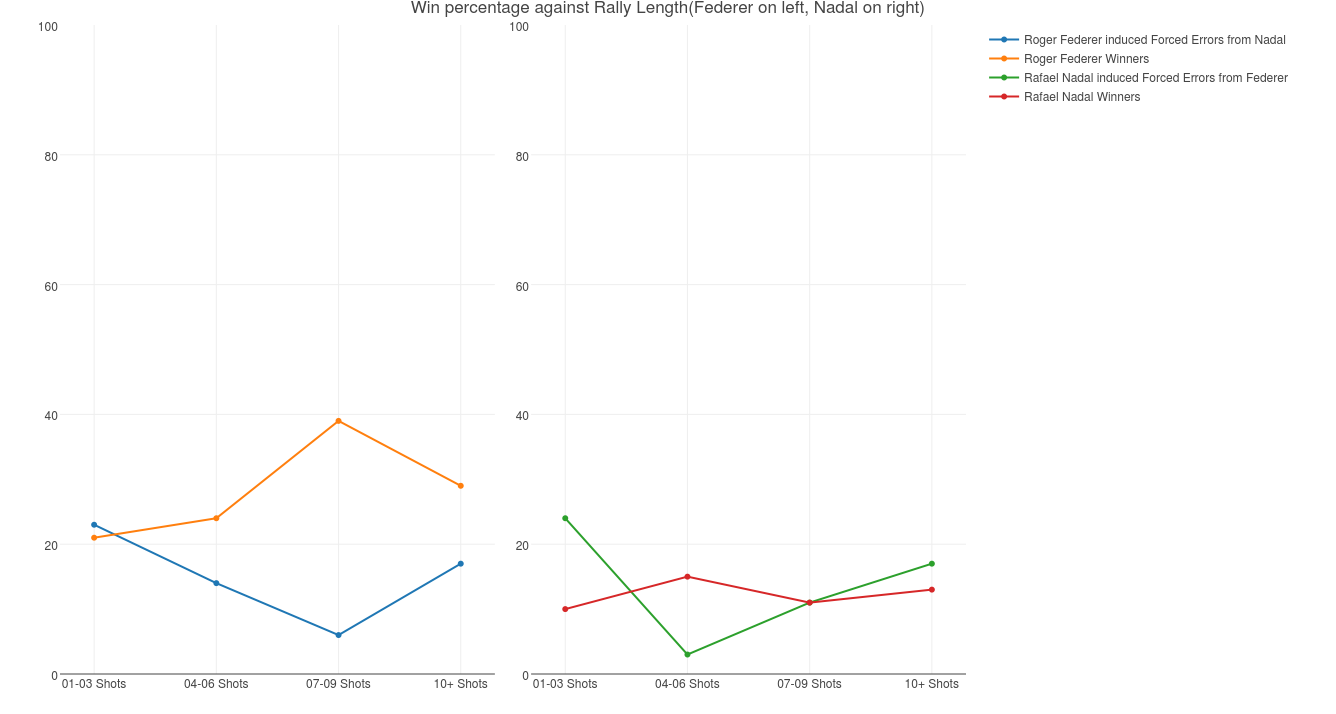
On the left is Roger Federer’s percentage points won via winners and induced forced errors(from Nadal), on the right is Rafa. The Nadal strategy certainly seems valid(the visible increase increase post 6 shots), forced errors fetching him more points than winners! On Federer’s side, his winners are in a different league, fetching him more than 30% points post 6 shots.
Who Dominated!
The scores say that the match was well-fought, the sets being shared alternately. However i wanted to look at the game-wise dominance of both players, and the game score is a handy variable to measure against.
Dominance Score: I didnt go into deeper metrics like rally length(how tough a point is!), just looking at the share of points won in that particular game. Lets say Roger won his game 40-15 – Roger’s dominance score would be 0.8, while Rafa’s dominance would be 0.2.
An interesting statistic – Roger’s average dominance in his service games is 0.71, while Nadal stands at 0.66. Fed having it a tad easier on his serves!
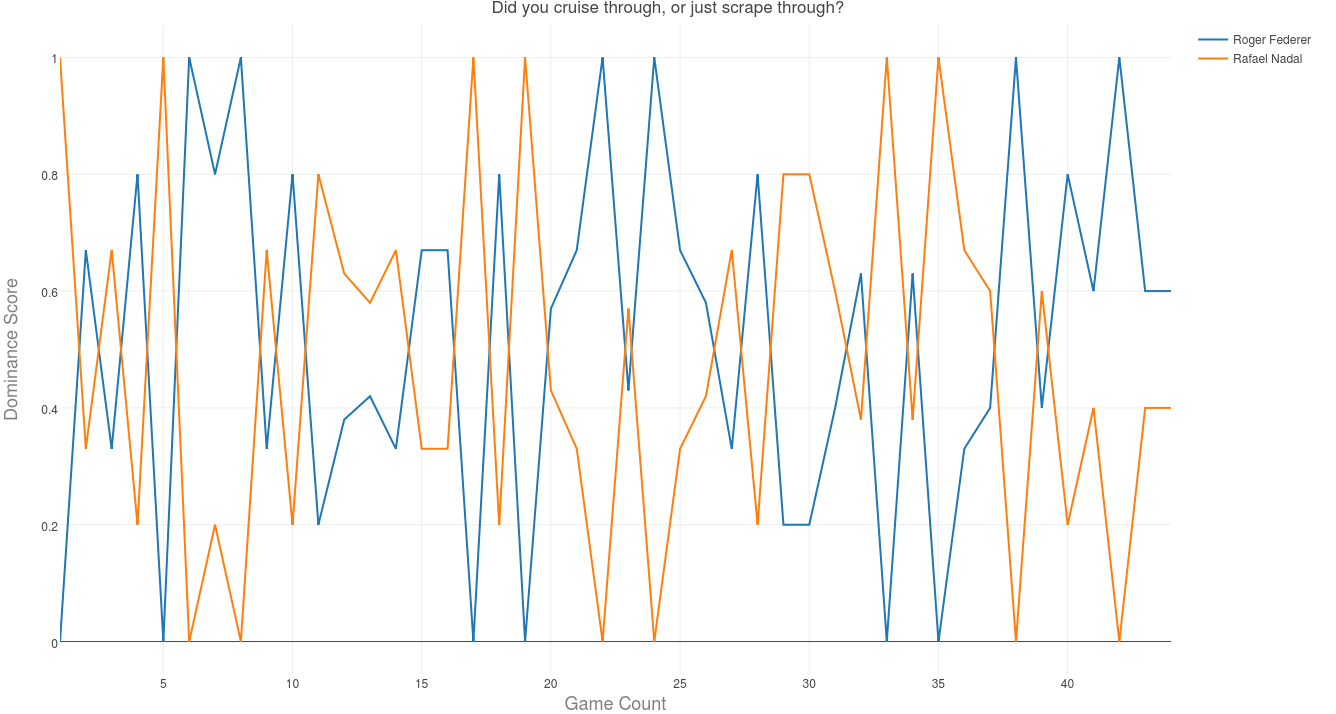
This is a game-by-game dominance score for both players, there is the expected zigzag due to service changes. Have a look at Games 6-8 where Roger broke Nadal in the first set, and Games 11-14 where Nadal took 4 consecutive games! Finally, in the fifth set Roger was broken initially(barely), but he came back winning the last 4 games on the trot!
Serve
One of the most important factors of a player’s gameplay, your serve dictates the style of rally which will follow! I’ve broken down their serve strategies, whether they’re looking for shorter rallies, and how varied are their first and second serves.
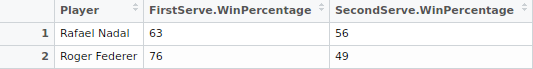
Clearly Roger has a better first serve(22% aces on first serve!), but Rafa holds it up on the second serve(with that kick!).
Serve Direction - The directions are broken down into three broad categories, “Wide”, “Body” and “T”. Have a look at their percentages on the Deuce(left side) and Ad courts(right side).
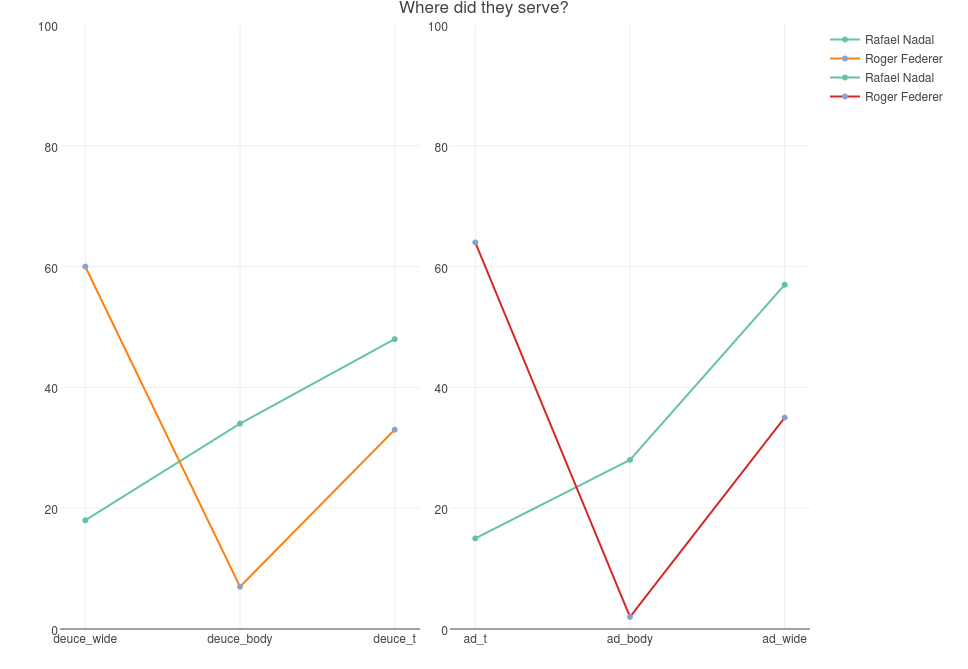
The x-axis is in the natural order of serving, deuce_wide to the far left and ad_wide to the far-right.
It is important to keep in mind that Roger plays right-handed while Rafa plays lefty to understand the patterns. While Roger plays backhands on the Deuce T and Ad Wide, Rafa plays backhands on the Deuce Wide and Ad T. Roger shoots 60% serves to Rafa’s backhands, while Rafa shoots more than 50% to Roger’s backhands. The pattern is almost symmetric on both deuce and ad court!
Also note how Roger is almost never serving on the body, but Rafa is doing that 30% of the times – Interesting! Does it pay dividends?
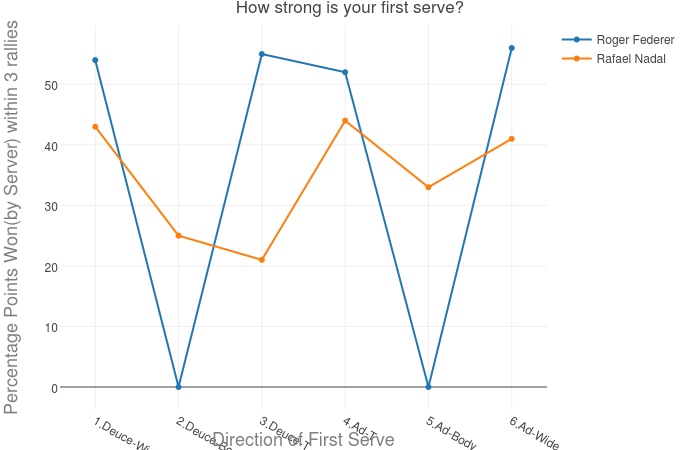
Percentage of points won by server in 3 points or less
For Nadal, serving to the body isn’t acting out as a great advantage(in short points) – it is almost similar as serving to the backhand on the Deuce Court, and the worst direction on the Ad Court. For Federer, the short points are finished off almost equally in all directions!
Now lets shift our focus to the progression of points on their serves – How long a rally do the servers need to close the point?
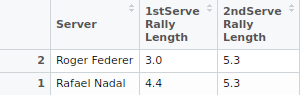
As we’ve seen earlier, Roger’s first serve is mighty effective! Since Rafa had a higher win percentage on second serves, I’d expected those rallies to last shorter – Dead equal for both! 5.3 rallies per second serve – could be a consequence of Nadal dictating the rally with his groundstrokes. Lets go a little deeper, shall we?
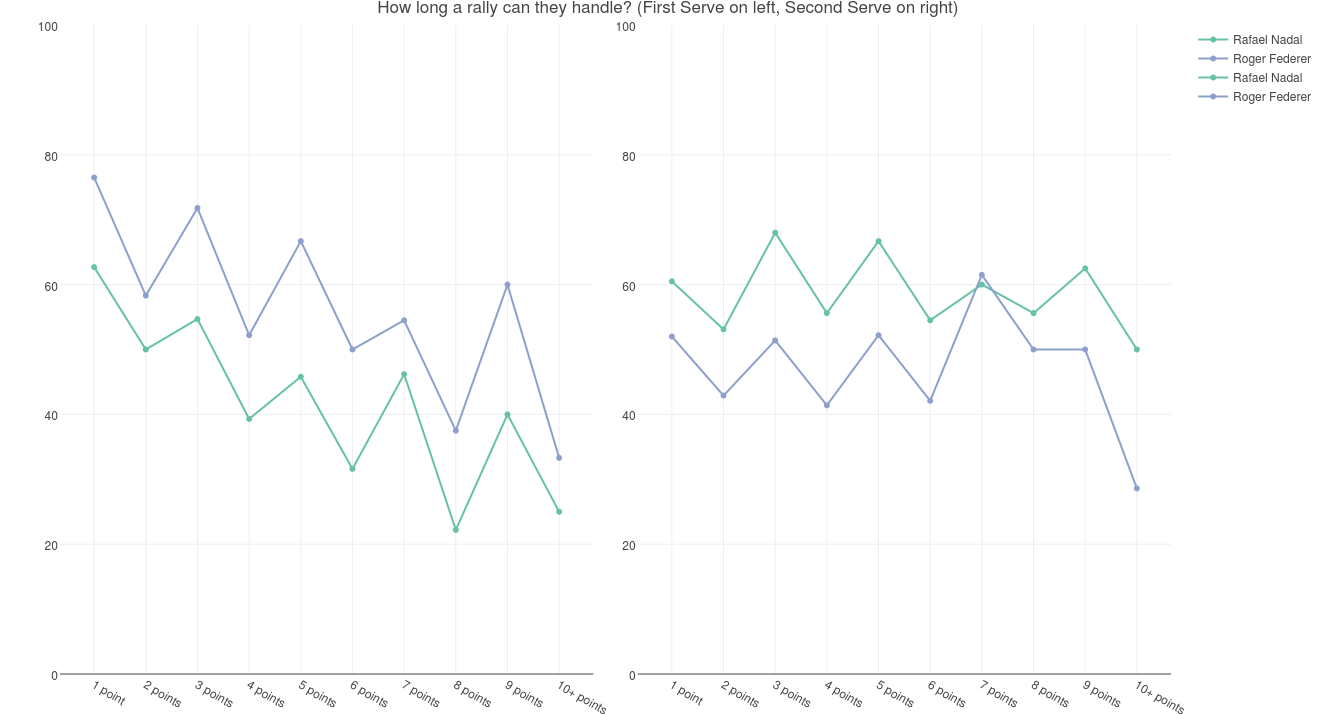
The plot on the left indicates percentage points won on first serve against number of points in the rally, the plot on the right hand side does it for second serves. A very intriguing zigzag pattern is visible, because both players have the upper hand when the ball is in his court! As per our earlier observations, Rafael leads in the second serve while Roger does so in the first serves.
The steady decline in the first serves shows how the longer a point gets, the longer the odds are stacked against him – If it was a strong serve, the point should’ve finished earlier, the fact that the rally is still alive indicates that the returner has the upper hand!
Return of Serve
Enough serving, lets get some good returns in! We’ll have a look at the which shots were played while returning, from which positions and the depth of the returns.
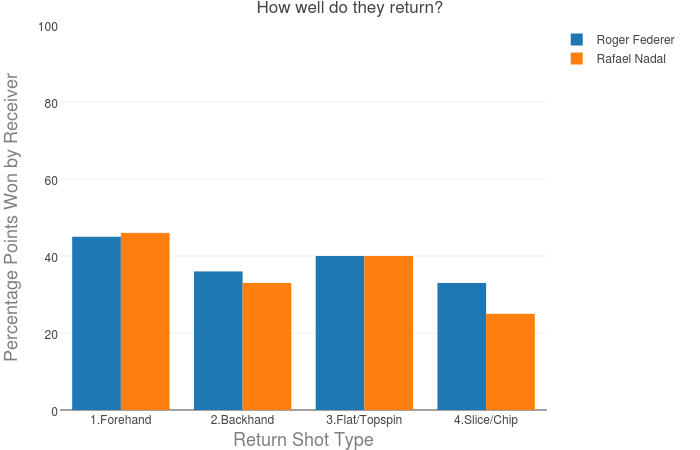
As per reports, Federer has an upper hand on backhand returns while Rafa edges Roger slightly in the forehands. Don’t look too much in the slice & chip returns, the volumes are too less for any insight.
We’d seen the surprisingly high body serves from Nadal, lets see how Federer reacts!
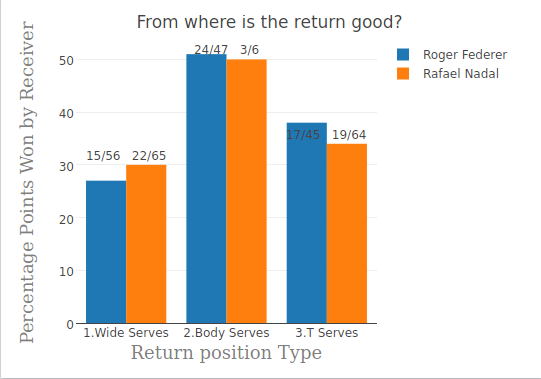
Almost a 50% win on the body serves for Roger Federer – incredible! Rafa, please serve out wide! Nadal also has a 50% win on body, but they account for only 6 serves in total (insignificant for insights).
Good returns are usually fast deep ones, which put the server in a surprised state. Weak short ones are usually dispatched easily, and that is why both players have preferred serving to their opponents’ backhands.
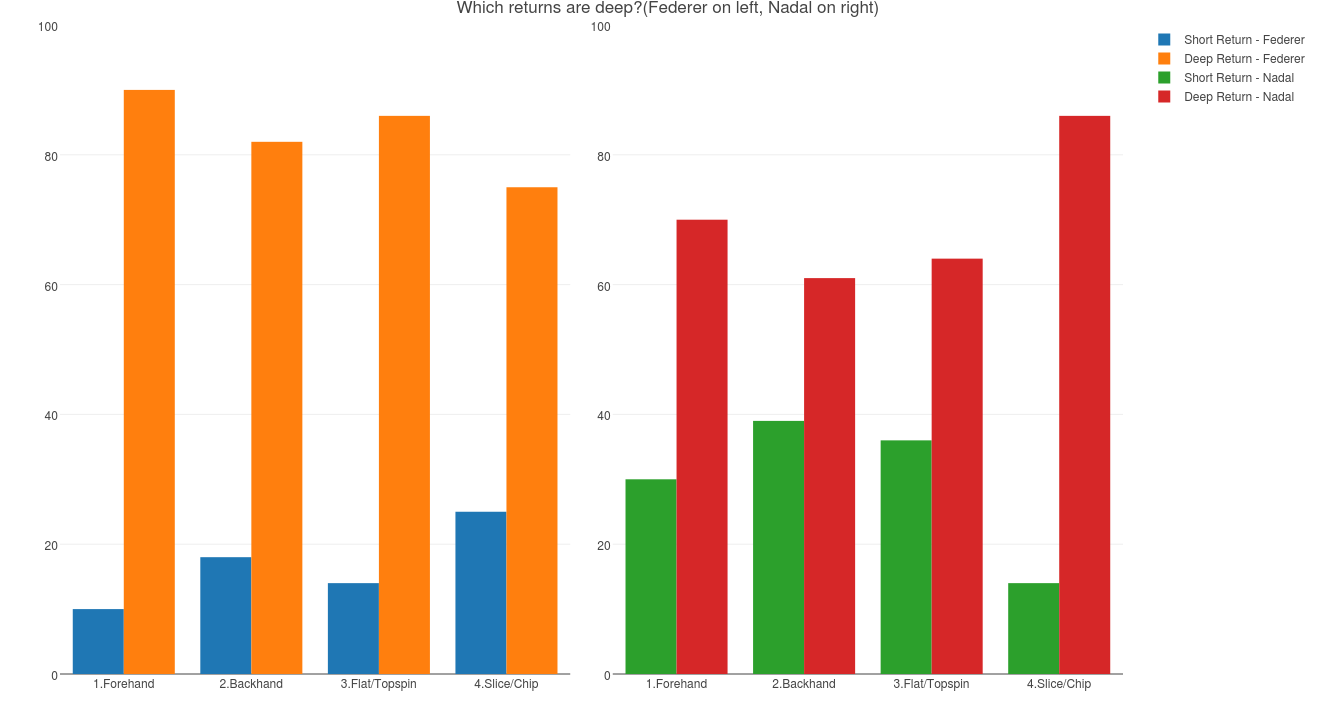
Shown are the percentages of short and deep returns by Federer(on left) and Nadal(on right). Federer has deeper returns across all shots, exceptional on the forehands! Clearly, Rafa should be working on the returns, this would’ve been a high contributing factor to the high percentage of 3-rally points on Federer’s serve.
Groundstrokes
After the serve is shot and a return is fired, we still gotta play the point, right! Lets focus on the shot directions by both players – More down-the-line backhands by Federer, and inside-out forehands by Nadal?
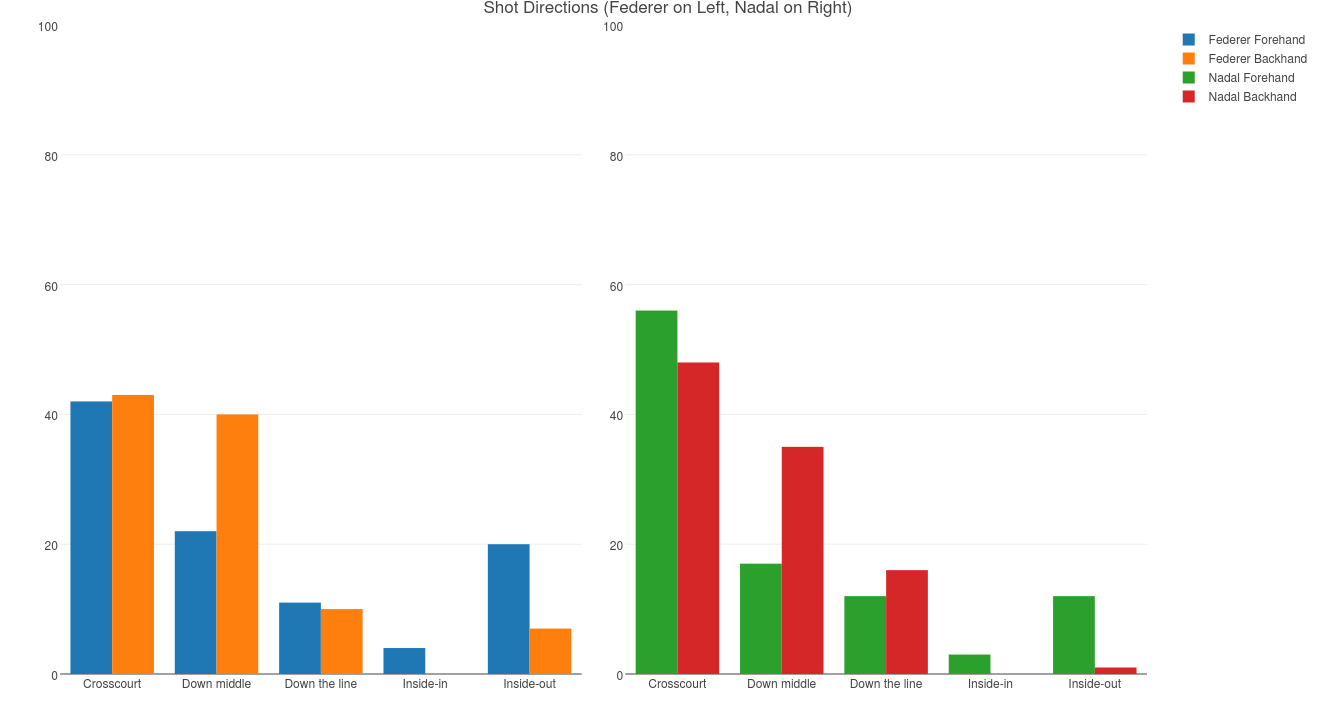
Blue bars represent percentage of forehand shots that were crosscourt, down middle, down the line, inside-in and inside-out. Federer on left, Nadal on right
I was surprised by the high amount of crosscourts hit by both players! As expected, a higher backhand percentage when shots are hit in the middle, indicating a lower risk taken on backhands. Another very surprising statistic – Roger hit 42 inside-out forehands(20%) compared to Nadal’s 27(12%). Would never have guessed this, lets see whether these inside-outs are effective in finishing the point?
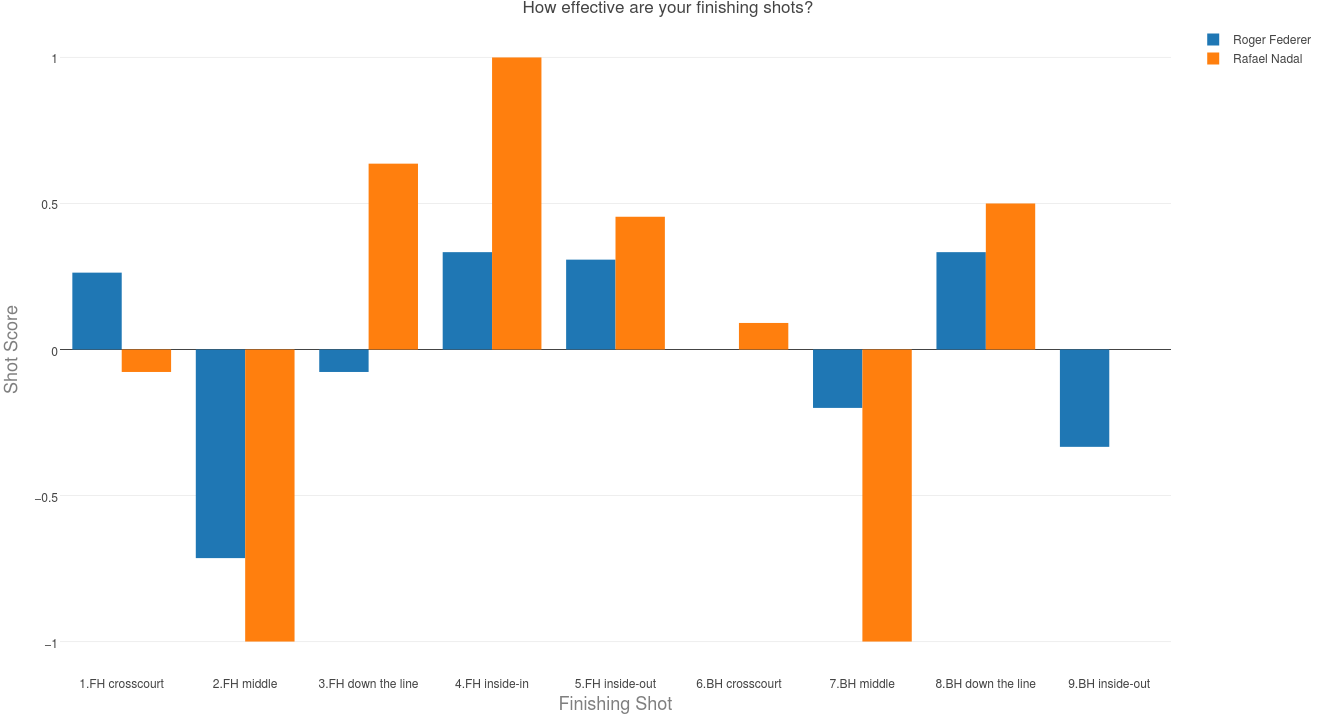
To calculate the effectiveness of a finishing shot, i’ve considered three factors –> +1 if the shot was a winner or induced a forced error from the opponent(on the following shot), and a -1 if the shot turned out to be an unforced error. Thus, if Rafa played 5 backhand point enders, of which 2 were winners, 2 induced errors from Roger and 1 was an unforced error from Rafa, his backhand score would be (2+2-1)/5 = 0.6
Lets dissect the above plot, it gives a lot of insights!
- Forehand crosscourts were okayish for Roger, but a little too many errors from Rafa
- Forehands down the middle were not at all pretty, particularly for Rafa(6 unforced errors, 1 winner).
- Well, Rafa’s forehand down-the-lines are perfect as ever (banana shot anyone?). Roger is being penalized a lot for his unforced errors, shows how streaky he has been playing!
- Coming to the inside-ins and inside-outs, Roger might have hit more but no one is beating Nadal on that front!
- Backhands down-middle not looking good either. Basically don’t hit the ball in the middle!
- The backhand down-the-lines are again a display of streakiness from Roger Federer(4 winners, 2 Forced errors and 3 unforced errors)
A couple more visualizations at the finishing shots
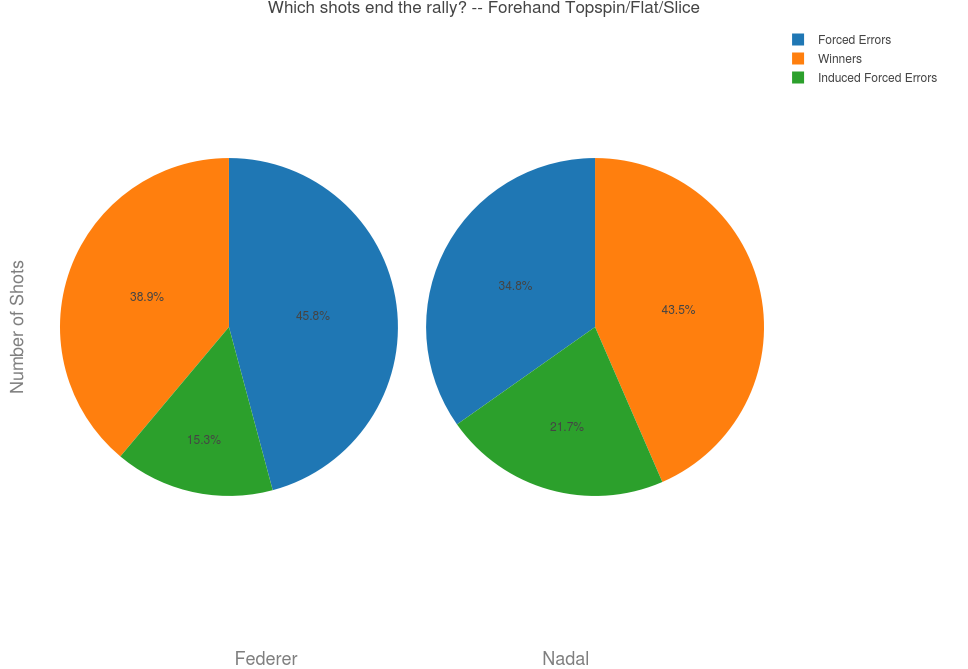
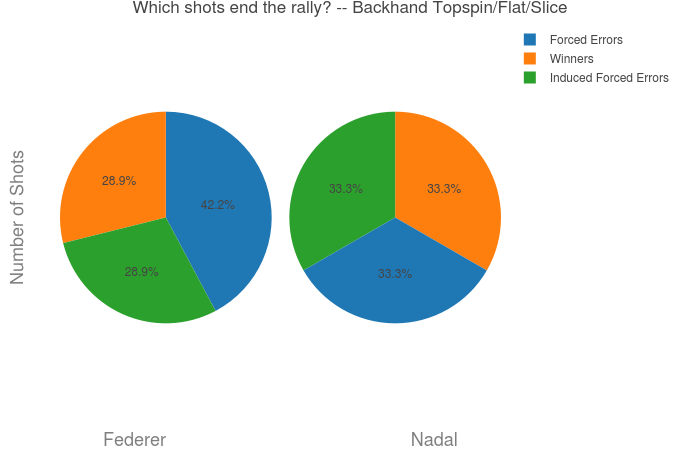
Both pie charts show the dominance of unforced errors from Federer, also how Nadal is generating an unusually high number of points from forced errors!
The Net Play
With Federer killing the net game in recent years and Nadal being a predominantly baseline player, this is pretty much a giveaway!
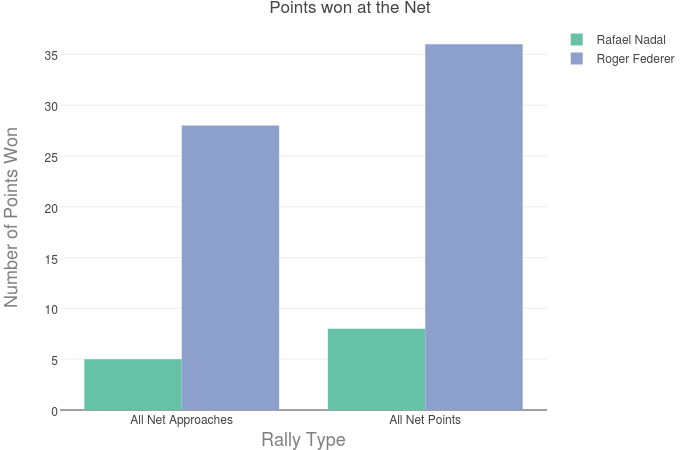
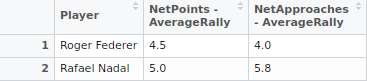
An interesting statistic is how short rallies are when Federer decides to come up the net. I can totally imagine Federer serving, coming up and killing it with his volley, and then Nadal hitting it into the net – 4 rallies!
I told ya!
Pressure Points
Now that we know how risky Federer’s gameplay has been, how did he manage to hold his own in the fifth set, especially being down a break! I’ve tried understanding the pressure points, my definition states a “Pressure Point” as one when the server is down more than one point on his serve(eg. 0-30 or 15-40), or when he’s down a break point(40-AD).
Here is a plot of the pressure points by sets.
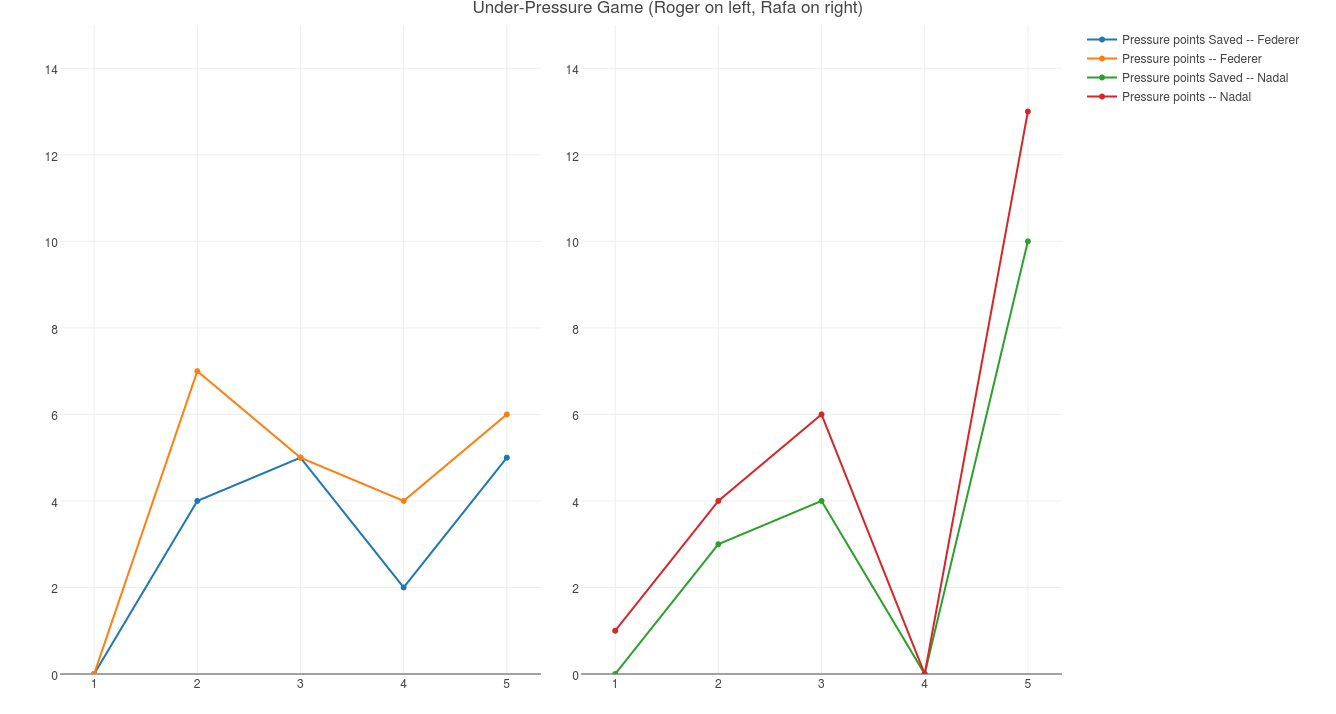
Pressure points and Pressure points saved, Federer on left, Nadal on right
The set dominance is visible by the zigzags, the gap between the two curves are turning out to be the crucial break points lost! In the first set, Roger didn’t face a single pressure point, a similar case with Nadal in the fourth set. The fifth set is very interesting – Despite losing on a pressure point, Federer fought back, putting Nadal under immense pressure(13 points!). Eventually Roger took the last 4 games on the trot, clinching the title :)
Conclusion
- Roger hit a lot more winners and a lot more unforced errors overall. Streaky gameplay!
- Roger was more dominant than Rafa on his serve(0.71 against 0.66)
- Roger’s first serve was more effective, he won a high percentage of short points on his serve
- Rafa had a stronger second serve, consistently better along the length of the rally.
- Both players served to the opponents’ backhands, Rafa served a sizeable amount on Roger’s body.
- Serving on the body didn’t work for Rafa – Lost 50% of those points
- Both players had a high crosscourt shot percentage, Roger hit more inside-ins and inside-outs than Rafa. Surprising!
- Rafa had a better finishing score across all shot types – Roger made too many errors.
- Roger played an extraordinary net game, finishing points within 4.5 rallies from the net.
- The pressure points were handled almost equally by both players… until the fifth set. Roger pumped it up, 13 pressure points for Rafa in the final set, who eventually gave in!
All in all, this analysis serves as the starting point for many more – I’d love to see how the finishing shots, serve directions, and pressure points were handled by both players over the years!
Wimbledon ‘08 should tell a different story, eh? ;)


Shubhankar is an awesome person. He's Co-Founder at Houseware, building the next generation of Analytics. In his spare time, he likes to go out on runs!