Did you know that you can navigate the posts by swiping left and right?
Top 15 finish in Indiahacks Machine Learning challenge
04 Jul 2017
. category:
math
.
Comments
#data science
#indiahacks
#report
Working right on the back of a couple of gruelling Kaggle competitions, the Indiahacks ML challenge seemed like a free hit! With a couple thousand lines of code still fresh in my mind and a couple weeks’ worth of effort, i ranked 14th amongst 800 odd participants :)

The Problems
- Market Segmentation(hosted by Hotstar): Based on previous watching history of each user, the genres watched, the time_watched of every show and other temporal factors, we had to predict a particular segment of the population(auc being the error metric). Now the demographic of this segment wasn’t available, and all we had was an idea that people who watch a particular genre/shows are contained in this segment
- Roadsign Prediction(hosted by Here): Here’s cars go around roads capturing images of various roadsigns, with a four-directional camera mounted on the top. Given the metadata around these images like angle of each cam to the roadsign, aspect ratio of the signs, we predict where each roadsign is actually pointing to(rear, left, front or right), m-logloss being the error metric
My Approach – I started off with a couple of starter scripts, getting the jsons ina digestable format. As usual, got running base with a basic random forest submission which were giving a respectable accuracy, just with the given heuristics.
This was one of the rare competitions where i really focussed on visualizations and understanding the problem statements. For eg. just by comparing median times(heatmaps) of different genres showed me cricket was clearly not a preferred genre for our segment.
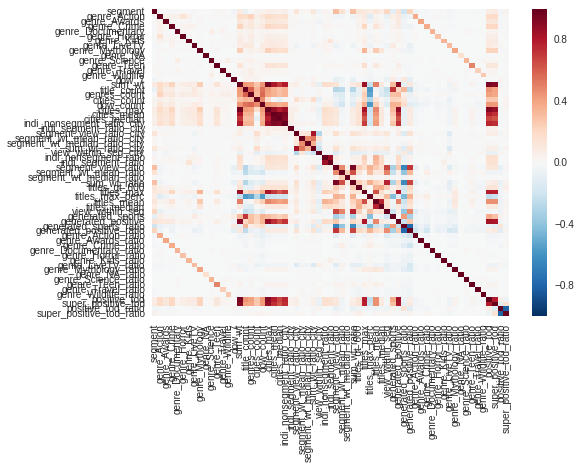
Above: a heatmap of all engineered features against “Segment”
For the roadsign problem, i went through many histograms to understand which cameras and respective aspect ratios were giving good predictive power.
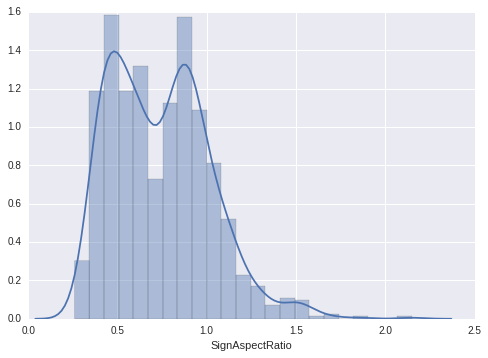
Above: histogram of aspect_ratio where the Left Camera was detected, but Road Sign pointed in the Front.
Market Segmentation – Feature Engineering
- Features collated: I collated similar features by observing their correlation with our target variable. For eg. “genre_Athletics” , “genre_Badminton” , “genre_Boxing” , “genre_Cricket” , “genre_Football” , “genre_Formula1” , “genre_FormulaE” , “genre_Hockey” , “genre_IndiaVsSa” , “genre_Kabaddi” , “genre_Sport” , “genre_Swimming” , “genre_Table Tennis” , “genre_Tennis” , “genre_Volleyball” were clubbed to form genre_sports
- Time of Day: The time_of_day features were separated into positive_tod, super_positive_tod and remaining_tod, again based on their correlation with “segment”
- Weekday/Weekends: I noticed Sunday was a largely important feature, as percentage of day_7 with other days was higher in segment=0 rows.
- Genres: The original watch_time was considered.Also, the ratio of watch_time of one genre compared to the total watch_time was considered.
- Show’s Title Analysis – Mean, median, sum of each title’s watch time was taken. The ratio of segment=1 rows against segment=0 rows w.r.t these mean/median-based features made a lot of sense. Individual watch time was also compared – How much was the show watched compared to median of Segment or Overall population
- Cities – I tried developing some features based on cities, but wasn’t getting a lot of improvement.
Market Segmentation – Insights
The heatmaps were very helpful in judging the effectiveness of certain features. Also, a validation pipeline with xgboost feature importances helped me in narrowing down to my hypotheses – The segment’s demography is middle-aged stay-at-home moms. The data backing this up:
- Almost no cricket is watched, a lot of drama/family/romance is.
- Time of day peaks in the afternoon(around 14:00) and again in the night(around 22:00).
- Sundays don’t contribute as much to watch times as it does for the rest of the population.
- The top titles and watch times, told a clear story :)

Roadsign Prediction – Feature Engineering:
- Since most of the features were captured in the aspect ratio and detected_camera, i just used some variations of the given features:
angle on right cam=angle on right cam- 50angle on rear cam=angle on rear cam- 180angle on left cam=angle on left cam- 220
- Generated some collective features(mean angle based on combination of detected_cam and target). Also used the difference of angle w.r.t these collective means.
- Truncated ID – I thought the truncated ID(ID without last character) might have some effects, so included the count of rows with same truncated_ID(might signify same car having snaps in quick succession).
Roadsign Prediction – Insights:
Basically, whenever an image was captured from the front cam, it was highly likely that the roadsign showed “front”. Except in cases where the aspect ratio was highly skewed in cases when the car might be taking a sharp turn, and the front cam captured the image from a weird angle. The aspect ratio is essentially, the apparent height of the roadsign divided by the apparent width of the roadsign, which is skewed mostly when cars are taking sharp turns.
Models – XGBoost is love, XGBoost is life

For both problems, i ran an optimized(but vanilla) xgboost, for better or worse. I’d tried my regular go-tos, the random forests, gbms, and highly inefficient keras nets, and also a failed attempt at stacking.
I could’ve gained a few places if i’d dedicated more time to stacking, bad planning and management on my side. This problem has been coming up for the past two competitions, clearly not an ideal scenario.
Anyway, i got a 0.9990232 AUC in the Hotstar problem, and a 0.18053 logloss on the roadsign problem, fairly satisfied with my performance. Looking forward to the zonals stage coming up next month, excited!
So yeah, that’s that. One competition ends, another begins. ML is addictive!

Shubhankar is an awesome person. He's Co-Founder at Houseware, building the next generation of Analytics. In his spare time, he likes to go out on runs!